Response to Climate Change

Climate Change Risk Management System
DRB manages risks in a total of four stages, beginning with climate change risk assessments and ending with reaction and improvement. We review the results from regular risk analysis, incorporate them into our management strategy, and review the performance and improvement plans in connection with specific risk management activities. Moving forward, we intend to formulate strategies grounded in the specific risks and opportunities identified at each business site through advanced analytics.
좌우로 스크롤 하시면
내용이 보입니다.
| 1. Climate change risk analysis | 2. Review of response plans | 3. Risk management and response activities | 4. Monitoring and improving risk response performance |
|---|---|---|---|
|
|
|
|
DRB 2050 Net Zero Roadmap
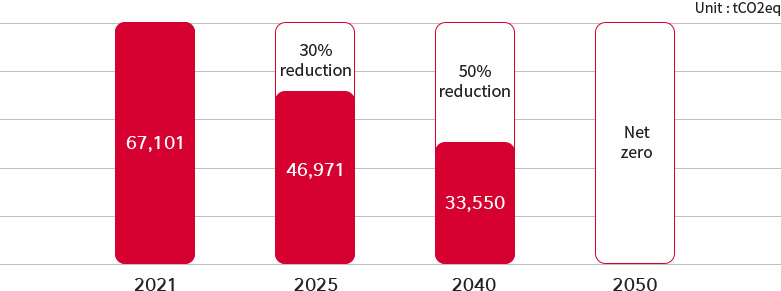
DRB is preparing to establish carbon neutrality roadmaps for each corporation, focusing on key subsidiary corporations with high carbon emissions. As the initial step in this direction, we are providing guidance by setting up a company-wide emission (Scope 1 + 2) reduction plan. With 2021 as the baseline year, we plan to achieve approximately 30% reduction by 2030, 60% reduction by 2040, carbon neutrality in the automotive parts sector by 2045, and company-wide carbon neutrality by 2050
1) DRB Holding and DRB Automotive were split off into a holding company and a business company through a spin-off in 2022. Starting from 2022, emissions of DRB Holding are included in ‘Others’.
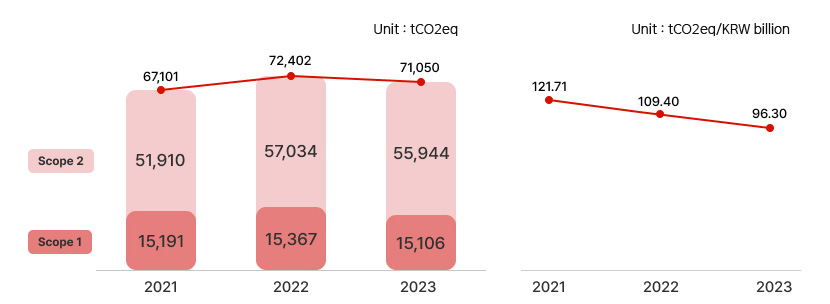
Global DRB Carbon Emission
DRB GHG (Scope 1+2) Emissions and Intensity
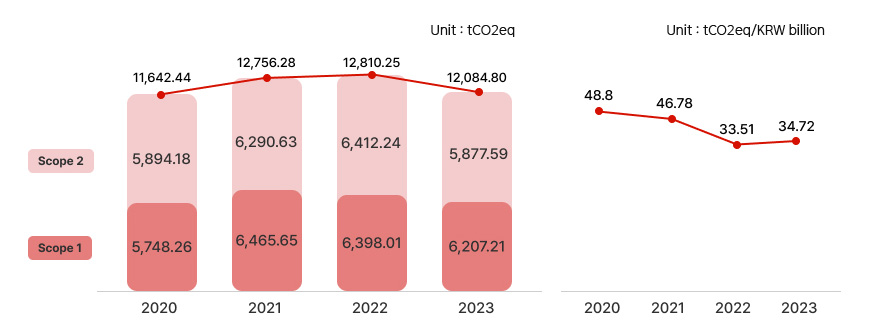
DRB Industrial
DRB Industrial has set a goal to reduce its greenhouse gas emissions by 28% by 2030 compared to 2021. It pursues a reduction strategy focused on increasing energy efficiency and cutting unnecessary energy consumption. To this end, DRB Industrial has established implementation measures centered on optimization of production processes and energy savings. It strives to minimize power consumption by analyzing energy usage of each process to reduce unnecessary operations and by introducing high-efficiency motors and inverters. Additionally, further reduction effects are anticipated from converting plant lighting to high-efficiency LEDs and optimizing heating, cooling, and ventilation systems. Considering the feasibility of renewable energy transition within Korea, DRB Industrial is considering the introduction of external renewable energy purchases (PPA) and exploring ways to increase the proportion of renewable energy use in the medium to long term.
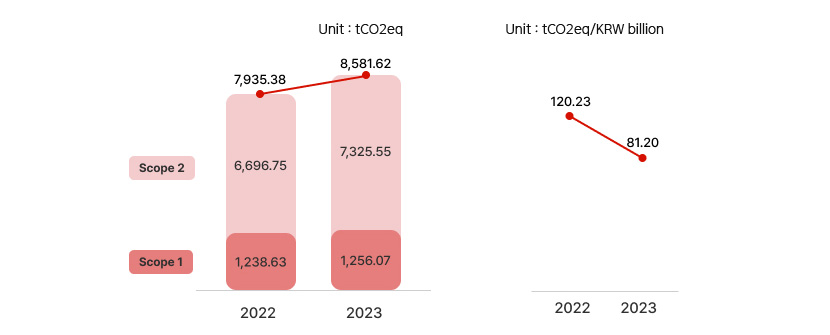
DRB Automotive
DRB Automotive has set a goal to achieve a 20% reduction by 2030compared to 2021 through energy savings and efficient operations in manufacturing processes. To attain this goal, DRB Automotive is considering plans to minimize unnecessary energy use through automation and operational optimization, and to maximize energy efficiency by establishing a real-time monitoring system. In addition, to achieve reductions at the raw material stage, the use of recycled rubber and low-carbon materials is gradually expanding. DRB Automotive also plans to increase the application of sustainable raw materials to meet the eco-friendly requirements of OEM automotive customers. In 2024, by leasing out its business site, DRB Automotive constructed a solar power generation facility and signed a 20- year usage contract, covering 15-20% of the existing electricity consumption with renewable energy. In the future, considering Korea’s renewable energy transition environment, DRB Automotive plans to expand the use of renewable energy by purchasing Renewable Energy Certificates (REC) for RE100 response and by concluding additional PPA contracts.
DRB Qingdao
DRB Qingdao has established a strategy to maximize the efficiency of its high-carbon emission processes and enhance reduction outcomes through raw material improvements. To achieve a 30% reduction by 2030 compared to 2021, it is pursuing emissions reduction through energy savings and enhancements of raw material. DRB Qingdao is exploring plans to reduce energy consumption through process improvements and optimization of facility operations, and to prevent unnecessary power waste in the production process by expanding automation. Additionally, it is considering ways to increase the proportion of recycled rubber among its raw material and to strengthen collaboration with suppliers to reduce carbon emissions in the raw material supply chain. In 2023, it signed a long-term Power Purchase Agreement with an on-site solar power generator at its business sites and plans to expand the use of renewable energy in line with the carbon neutrality policies of the Chinese government. Additionally, where possible, DRB Qingdao plans to pursue measures to secure renewable energy through further cooperation with local renewable energy generation facilities.
DRB Slovakia
DRB Slovakia plans to respond to the strengthening of environmental regulations within Europe by increasing the efficiency of its plant operations and expanding the use of eco-friendly raw materials. With the goal of achieving a 28% reduction by 2030 compared to 2021, the corporation will simultaneously pursue energy savings within the facility and improvements in raw materials and the supply chain. To this end, it is reviewing measures to reduce energy consumption by optimizing the operation of its air conditioning system and replacing all lighting within the facility with high-efficiency LEDs. It is also developing strategies to minimize unnecessary power waste during non-operational hours by adjusting production schedules and equipment operation methods. In addition, to comply with European carbon regulations, DRB Slovakia plans to expand the application of low-carbon raw materials and increase the proportion of recycled rubber used. In 2025, it plans to install a solar power generation facility on the roof of its second plant (direct PPA), which will produce 613,227 kWh of electricity annually. This eco-friendly energy strategy is a key element in expanding the use of renewable energy within the corporation. Along with signing external Power Purchase Agreements (PPA), DRB Slovakia is actively promoting the use of eco-friendly electricity in collaboration with local renewable energy projects. Considering that companies in Europe are actively pursuing RE100 goals, DRB Slovakia aims to reduce carbon emissions and expand sustainable electricity use based on these plans.
DRB Vietnam
DRB Vietnam completed its second plant in 2024 and is considering measures to maximize the reduction effects by optimizing the plant’s operations and production processes. Aiming for a 34% reduction by 2030 compared to 2021, it pursues a reduction strategy that combines process improvements with the introduction of renewable energy. To optimize processes, it is reviewing ways to reduce unnecessary operations and achieve energy savings by introducing a smart energy management system. In terms of raw material use, it is also considering measures to reduce carbon emissions at the production stage by expanding the proportion of recycled rubber. As part of its transition to eco-friendly energy, DRB Vietnam is actively expanding the use of biomass fuel. Currently, renewable biomass resources such as rice husk pellets and sawdust firewood are used as the main fuel for plant operations, which helps reduce the use of fossil fuels and contributes to carbon neutrality. Utilization of biomass-based energy also creates positive effects for the cyclical use of resources and the vitalization of local resources, serving as a practical implementation case that aligns with DRB’s eco-friendly management strategy. Reflecting the regional characteristics of Vietnam, where solar and wind power generation is active, DRB Vietnam promotes the introduction of solar power generation facilities using idle land within the plant. To this end, it plans to install solar panels based on a Power Purchase Agreement (PPA) with a power generation company and will further strengthen its energy independence by linking with an Energy Storage System (ESS) if necessary. It is anticipated that these measures will reduce dependence on the external power grid while also contributing to the realization of DRB’s sustainable management goals for climate change response and greenhouse gas reduction by gradually expanding the proportion of renewable energy used in plant operations.
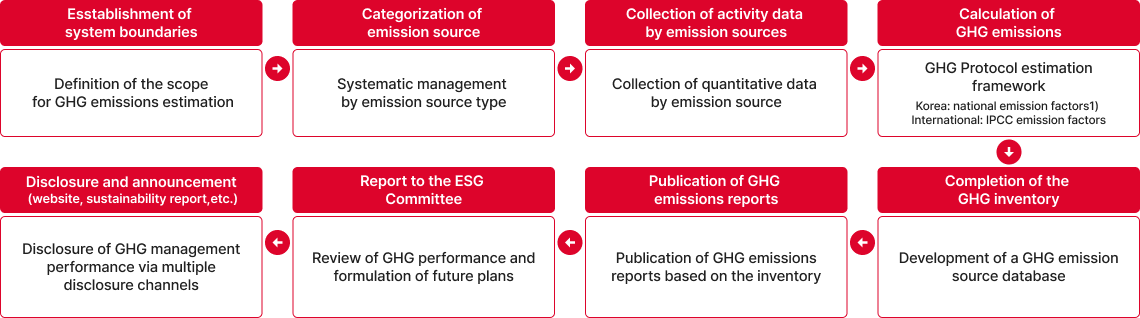
DRB GHG Inventory Development Process
1) Applying the 'Guidelines on Reporting and Certification of Emissions under the Greenhouse Gas Emissions Trading System’
Third-Party Verification of GHG Emissions
- To enhance the transparency and reliability of its sustainability management, DRB conducts regular third-party verification of its greenhouse gas emissions by external expert organizations. The verification is performed in accordance with internationally recognized standards such as ISO 14064-1 and ISO 14064-3, and we are gradually expanding the scope of verification to include Scope 1, Scope 2, and also Scope 3 emissions at our major business sites. Through this, we aim to ensure the accuracy and consistency of our greenhouse gas inventory and strengthen execution capabilities based on our climate change response strategy. The verification results are disclosed transparently through our sustainability report and various disclosure data, practicing responsible climate leadership built on the trust of our stakeholders.
Verification Target
- Korea : DRB Holding Co., Ltd., DRB Industrial Co., Ltd., DRB Union Beltinno Co., Ltd., DRB Automotive Co., Ltd., DRB Healthcare Co., Ltd., and DRB International Co., Ltd.
- International : DRB Qingdao (China), DRB Russia, DRB Slovakia, DRB Vietnam, DRB America, Inc. (LA, USA), DRB Georgia Office (Georgia, USA), DRB Indonesia (Jakarta, Indonesia), DRB Shanghai Co., Ltd. (Shanghai, China), and DRB Japan Co., Ltd. (Fukuoka, Japan)
Verification Standard
- ISO 14064-1:2018, ISO 14064-3:2019
- WRI/WBCSD GHG Protocol
- IPCC Guidelines for National Greenhouse Gas Inventories (2006)
- Operational Guidelines for Reporting and Verification of Emissions under the Emissions Trading Scheme (ETS)
- Verification Guidelines for the Operation of the Greenhouse Gas Emissions Trading Scheme
- Operational Guidelines for Vietnam’s Greenhouse Gas Emissions Trading Scheme
Verification Frequency
- Once per year (Annually)
Verification Scope and Method
- Direct Emissions (Scope 1): Fixed combustion, mobile combustion, and other greenhouse gas emissions.
- Indirect Emissions (Scope 2): Purchased electricity and purchased heat.
- Verified Greenhouse Gases: CO₂, CH₄, N₂O, HFCs, PFCs, SF₆.
Verification Agency
- Korea Quality Assurance Co., Ltd.(2022 ~ 2023)
- Korea Management Registrar Co., Ltd. (2024)
2024 DRB Greenhouse Gas Emissions, Scopes 1 & 2
Unit : tCO2eq/year
좌우로 스크롤 하시면
내용이 보입니다.
| Corporation | Scope1 | Scope2 | Scope1+Scope2 | ||
|---|---|---|---|---|---|
| Location-based | Market-based | Location-based | Market-based | ||
| DRB Holding Co., Ltd. | 11.18 | 84.61 | 84.61 | 95 | 95 |
| DRB Industrial Co., Ltd. | 5,603.34 | 5,895.77 | 5,895.77 | 11,494 | 11,494 |
| DRB Union Beltino Co., Ltd. | - | 64.52 | 64.52 | 64 | 64 |
| DRB Automotive Co., Ltd. | 1,272.69 | 7,692.52 | 7,692.52 | 8,964 | 8,964 |
| DRB Automation Co., Ltd. | 14.97 | 399.58 | 399.58 | 414 | 414 |
| DRB Healthcare Co., Ltd. | 3.43 | 380.83 | 380.83 | 384 | 384 |
| DRB International Co., Ltd. | 21.7 | 175.34 | 175.64 | 197 | 197 |
| DRB Qingdao | 5,208.80 | 18,615.26 | 14,187.90 | 23,824 | 19,396 |
| DRB Russia | 480.68 | 233.27 | 233.27 | 713 | 713 |
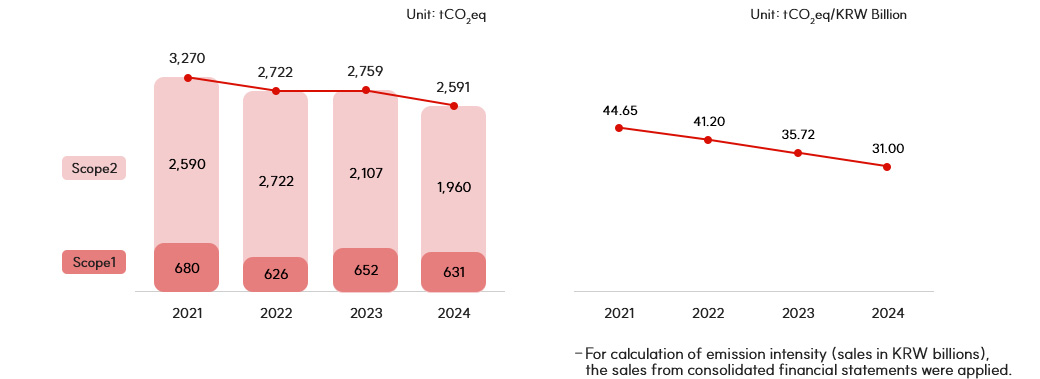
| DRB Slovakia | 631.37 | 1,959.81 | 1,959.81 | 2,591 | 2,591 |
| DRB Vietnam | 2,633.38 | 14,642.08 | 14,642.08 | 17,275 | 17,275 |
| DRB America, Inc. | 51.17 | 40.44 | 40.44 | 91 | 91 |
| DRB Indonesia (Jakarta, Indonesia) |
7.01 | 10.25 | 10.25 | 17 | 17 |
| DRB Shanghai Co., Ltd. (Shanghai, China) |
8.78 | 15.09 | 15.09 | 23 | 23 |
| DRB Japan Co., Ltd. (Fukuoka, Japan) |
0.64 | 7.2 | 7.2 | 7 | 7 |
* Due to rounding down at the facility level, the total emissions may differ from the sum of individual emission sources.
2023 DRB Greenhouse Gas Emissions, Scopes 1 & 2
Unit : tCO2eq/year
좌우로 스크롤 하시면
내용이 보입니다.
| Corporation | Scope1 | Scope2 | Scope1+Scope2 |
|---|---|---|---|
| DRB Holding Co., Ltd. | 7.84 | 82.32 | 90.16 |
| DRB Industrial Co., Ltd. | 6,207.21 | 5,877.59 | 12,084.81 |
| DRB Union Beltinno Co., Ltd. | 6.88 | 64.19 | 71.07 |
| DRB Automotive Co., Ltd. | 1,256.07 | 7,325.55 | 8,581.62 |
| DRB Healthcare Co., Ltd. | 3.15 | 427.63 | 430.78 |
| DRB International Co., Ltd. | 12.82 | 87.92 | 100.74 |
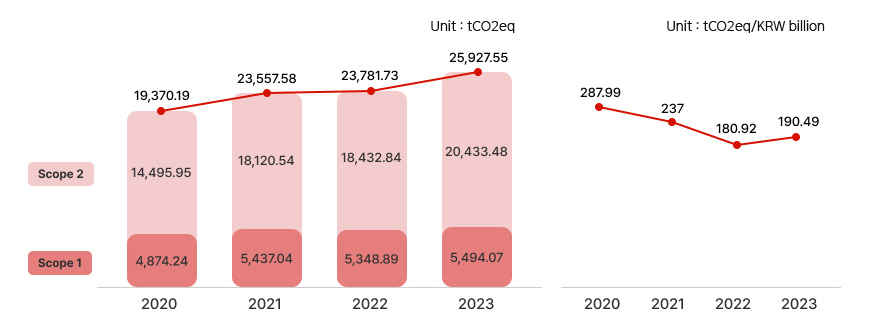
| DRB Qīngdǎo | 5,494.07 | 20,433.48 | 25,927.55 |
| DRB Russia | 451.81 | 105.83 | 557.64 |
| DRB Slovakia | 981.03 | 1,778.14 | 2,759.17 |
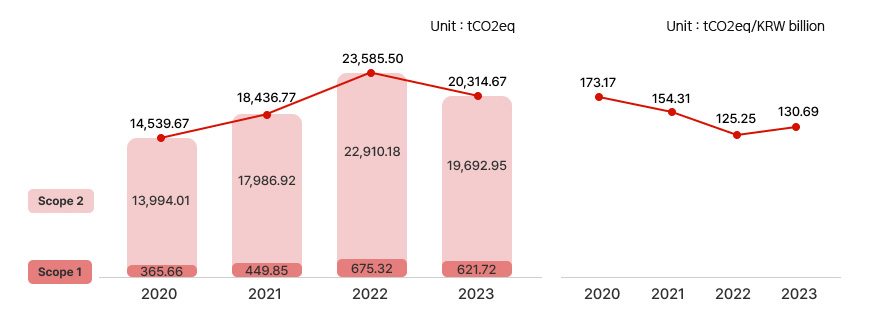
| DRB Vietnam | 621.71 | 19,692.95 | 20,314.66 |
| DRB America, Inc. (LA, USA) | 4.64 | 4.42 | 9.06 |
| DRB Georgia Office (Georgia, USA) | 46.71 | 38.13 | 84.84 |
| DRB Indonesia (Jakarta, Indonesia) | 7.26 | 10.23 | 17.49 |
| DRB Shanghai Co., Ltd. (Shanghai, China) | 4.43 | 9.92 | 14.36 |
| DRB Japan Co., Ltd. (Fukuoka, Japan) | 0.42 | 6.13 | 6.55 |
2022 DRB Greenhouse Gas Emissions, Scopes 1 & 2
Unit : tCO2eq/year
좌우로 스크롤 하시면
내용이 보입니다.
| Corporation | Scope1 | Scope2 | Scope1+Scope2 |
|---|---|---|---|
| DRB Holding Co., Ltd. | 6.83 | 104.30 | 111.13 |
| DRB Industrial Co., Ltd. | 6,398.01 | 6,412.23 | 12,810.24 |
| DRB Union Beltinno Co., Ltd. | 5.5 | 64.49 | 69.99 |
| DRB Automotive Co., Ltd. | 1,238.62 | 6,696.75 | 7,935.38 |
| DRB Healthcare Co., Ltd. | - | 437.39 | 437.39 |
| DRB International Co., Ltd. | 15.93 | 83.83 | 99.76 |
| DRB Chongqing | 616.23 | 3,223.32 | 3,839.56 |
| DRB Qīngdǎo | 4,740.04 | 15,209.51 | 19,949.55 |
| DRB Russia | 570.86 | 154.57 | 725.44 |
| DRB Slovakia | 626.35 | 2,095.89 | 2,722.24 |
| DRB Vietnam | 675.32 | 22,910.18 | 23,585.50 |
| DRB America, Inc. (LA, USA) | 3.2 | 5.26 | 8.46 |
| DRB Georgia Office (Georgia, USA) | 44.07 | 40.12 | 84.19 |
| DRB Indonesia (Jakarta, Indonesia) | 5.04 | 9.44 | 14.48 |
| DRB Shanghai Co., Ltd. (Shanghai, China) | 1.62 | 8.86 | 10.48 |
| DRB Japan Co., Ltd. (Fukuoka, Japan) | 0.55 | 4.68 | 5.24 |